Abstract
Disasters cost the global economy $520 billion (USD) and drive more than 26 million people into poverty each year. Floods continue to impact the largest number of people of any type of disaster globally, having affected more than two billion people over the last decade. The primary objective of this study seeks to unpack how different methods of assessing hazards influence disaster risk assessments.
Project Team
- Dr Aaron Opdyke
Funding
- Faculty of Engineering, Early Career Researcher Development Grant (50,000 AUD)
Research Questions
- How can community-based methodologies supplement and enhance engineering disaster risk assessments in resource-constrained communities?
Project Brief
The primary objective of this study seeks to unpack how different methods of assessing hazards influence disaster risk assessments. This study will draw from participatory action research conducted in partnership with the local government units in the Philippines.
Population and building exposure data will be linked, drawing from drone photogrammetry stitched to create high-resolution imagery and population data obtained from local census records. Building footprints will be extracted from the created digital surface model (DEM). This will also enable the creation of a digital terrain model (DTM) which will be used in flood modelling to determine inundation extents. These methods will be employed as there is an absence of high-resolution imagery and elevation data at the selected location – a common issue in many developing communities.
Social vulnerability data will be obtained from local census records and linked to building footprints, including age, gender, employment, and disability of individual household members. To capture building vulnerability, inspections of households initially sampled as part of the flood hazard survey will be completed as well as additional buildings near waterways. Observations will record the building foundation type, lowest opening height (floor level above ground), number of stories, and building material (e.g. concrete, timber) as indicators of flood vulnerability. Existing signs of flood damage (e.g. water damage or scouring around foundations) will also be recorded as a validation measure.
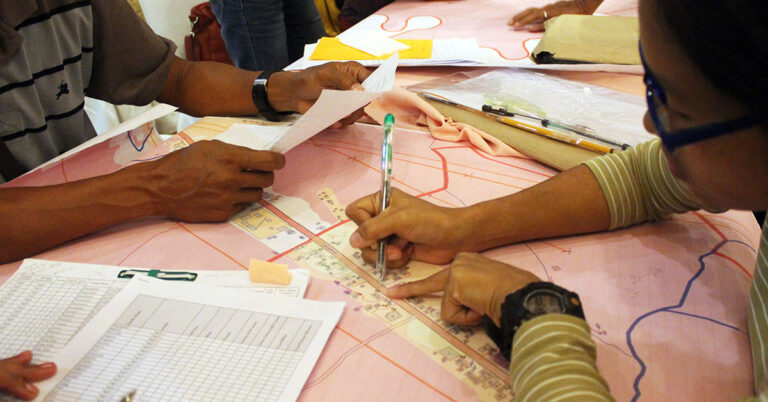
Three sets of hazard data will form the basis for comparison in this research. A household survey of flood hazards has already been collected covering 2,162 households – an approximately 20 percent sample of the total municipal population. Survey questions asked households to assess their flood hazard exposure (low, medium, high, or no exposure). Additionally, over 400 individuals participated in community workshops to map flood hazards in their respective communities. These hazard assessments, hand-drawn over base maps of communities, will be digitised, comprising the second hazard dataset. Lastly, historical weather data from a nearby station and historical flow data from local river gauges will be collected from the Philippine Atmospheric, Geophysical and Astronomical Services Administration to create flood inundation models.
Digital terrain models produced from earlier photogrammetry will be used to delineate watersheds and combined with climate data in HEC-RAS software to produce flood inundation depths based on two-dimension unsteady state flow hydraulic models. In order to compare differences in hazard exposure across data sources, flood depths from the collective-community assessments and engineering models will be overlaid on top of population and building exposure data. This will result in three flood hazard assessments for each household in the sample: (1) individual household; (2) collective community identification and; (3) engineering assessments from hydraulic modelling. These hazard evaluations will then be combined with social and physical vulnerability data to determine a risk assessment score for each household.